

Digital ad spending in the US has entered a phase of slower growth
According to eMarketer, digital ad spending in the US in 2023 is expected to record its slowest growth rate in 14 years. The growth rate is expected to pick up in 2024, reaching 11.2%. After that, the growth rate is expected to hover around 10% each year through 2027.
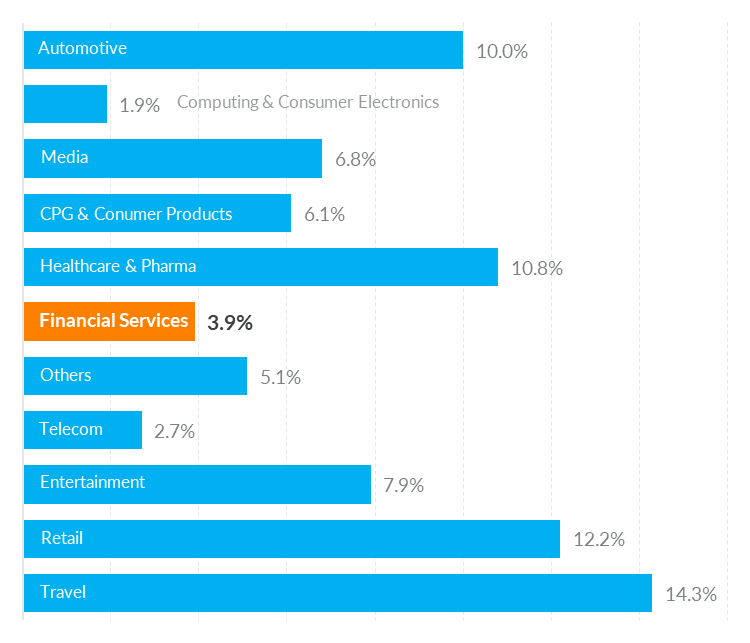
The rate of growth of financial services digital ad spending has been lower than some of the other industries.
Financial services saw a 3.9% growth in digital ad spending in 2023, compared to an 18.1% growth reported in 2022.
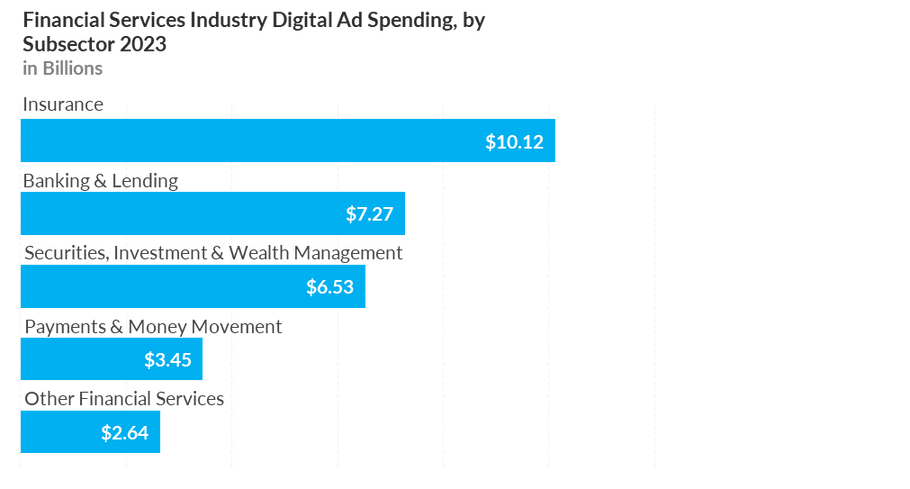
Insurance leads in digital ad spending
Among the financial services sub-sectors, insurance continues to be the leading category by a margin, with over $10.12 billion dollars spent on digital ads, even with a spending dip expected in 2023. Banking and lending come in second with over $7 billion in digital ad spends.
Social dominates push media spends for the financial services
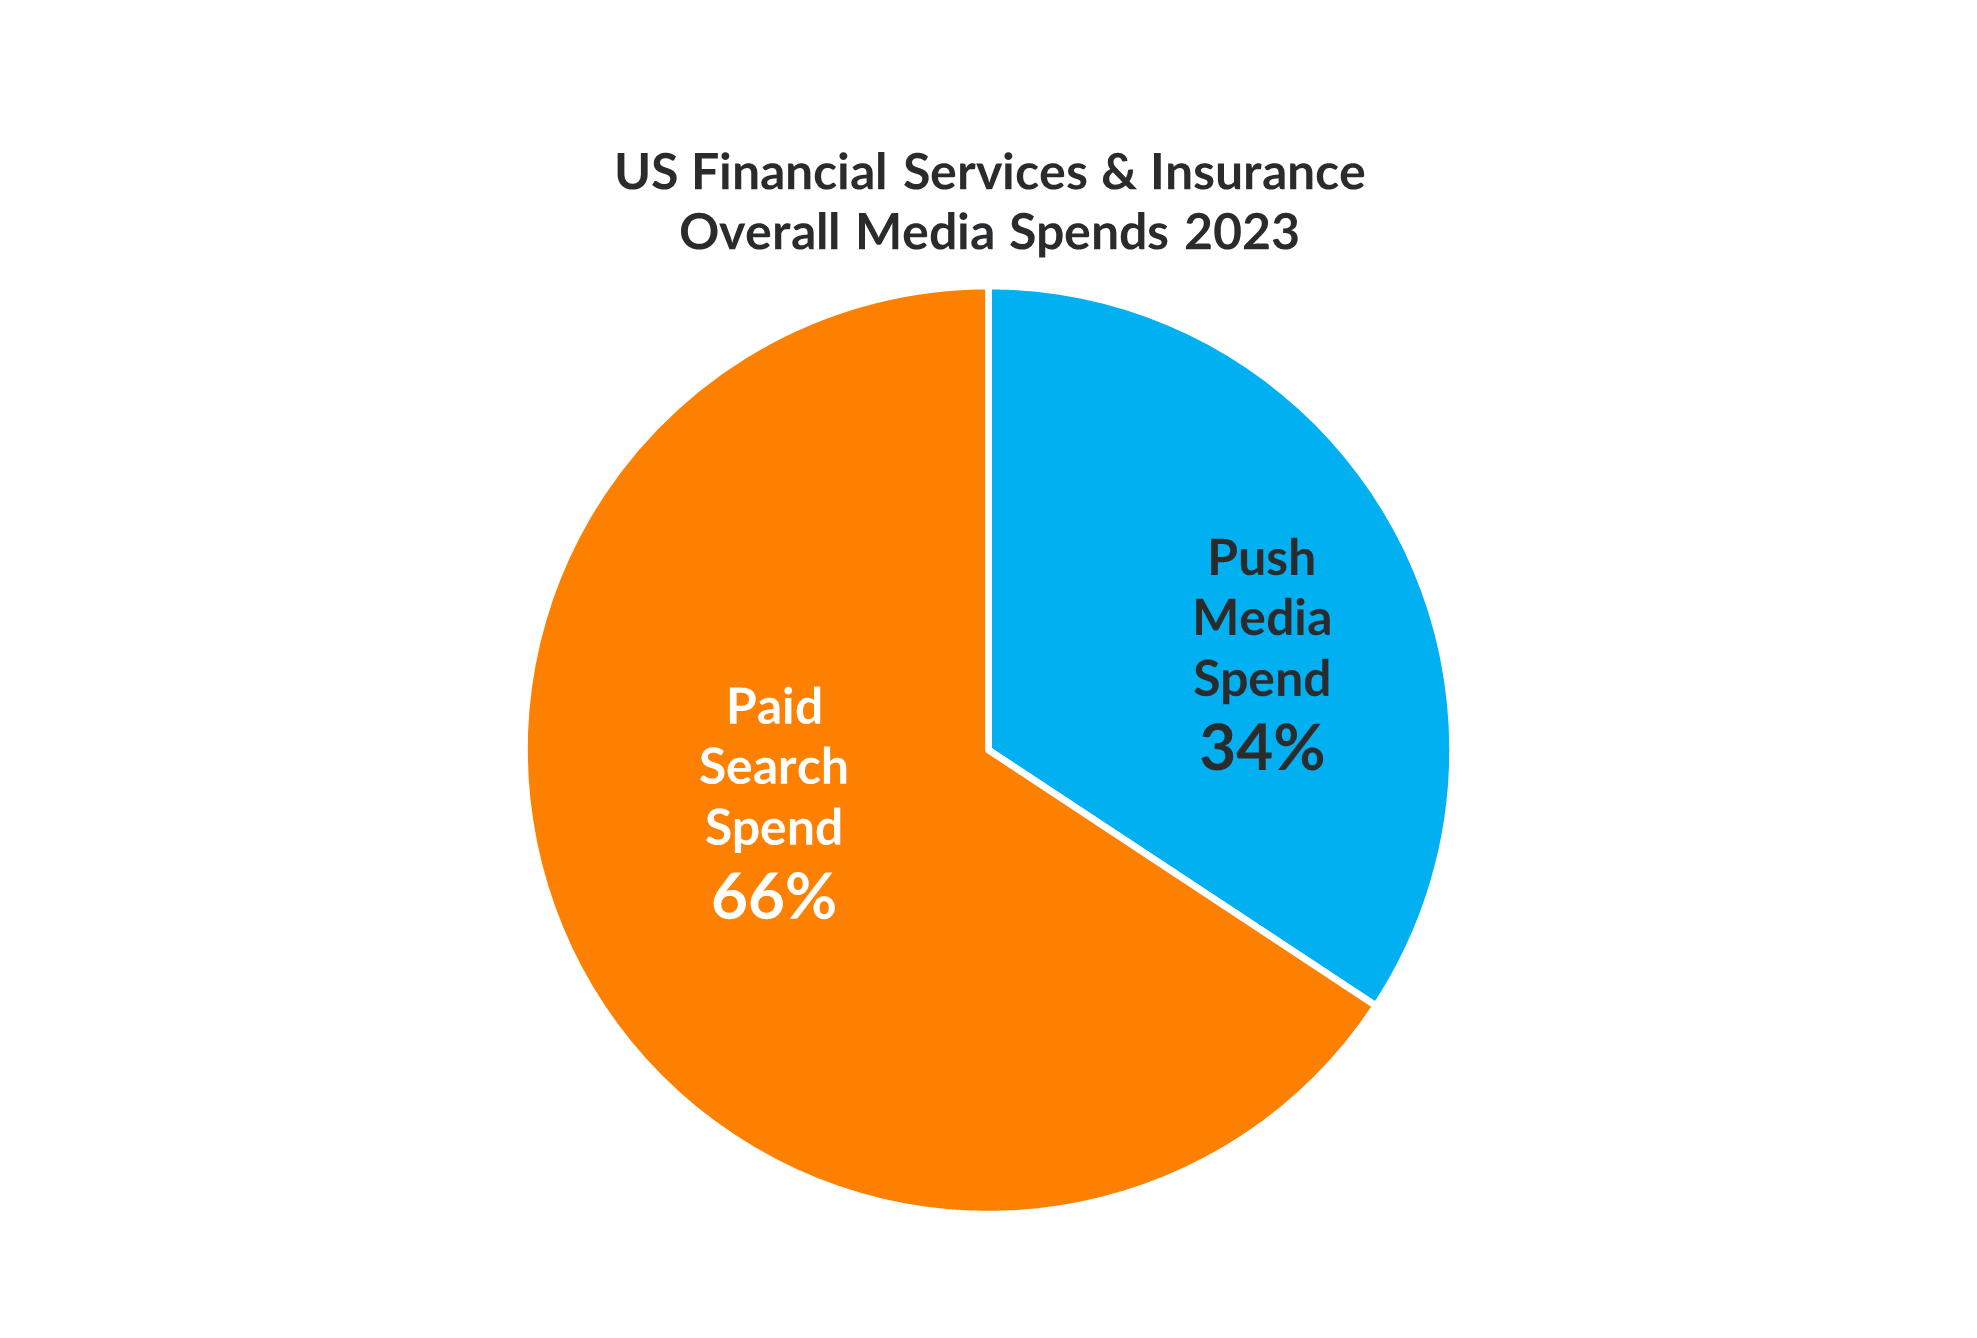
Of the overall US financial services and insurance media spending in 2023, paid search and push media accounted for 66% and 34% respectively.
The skew between the share of push media and paid search spending of
the category in 2022, which was mostly driven by PNC insurance has mitigated now and is not as prominent as we were seeing until last year.
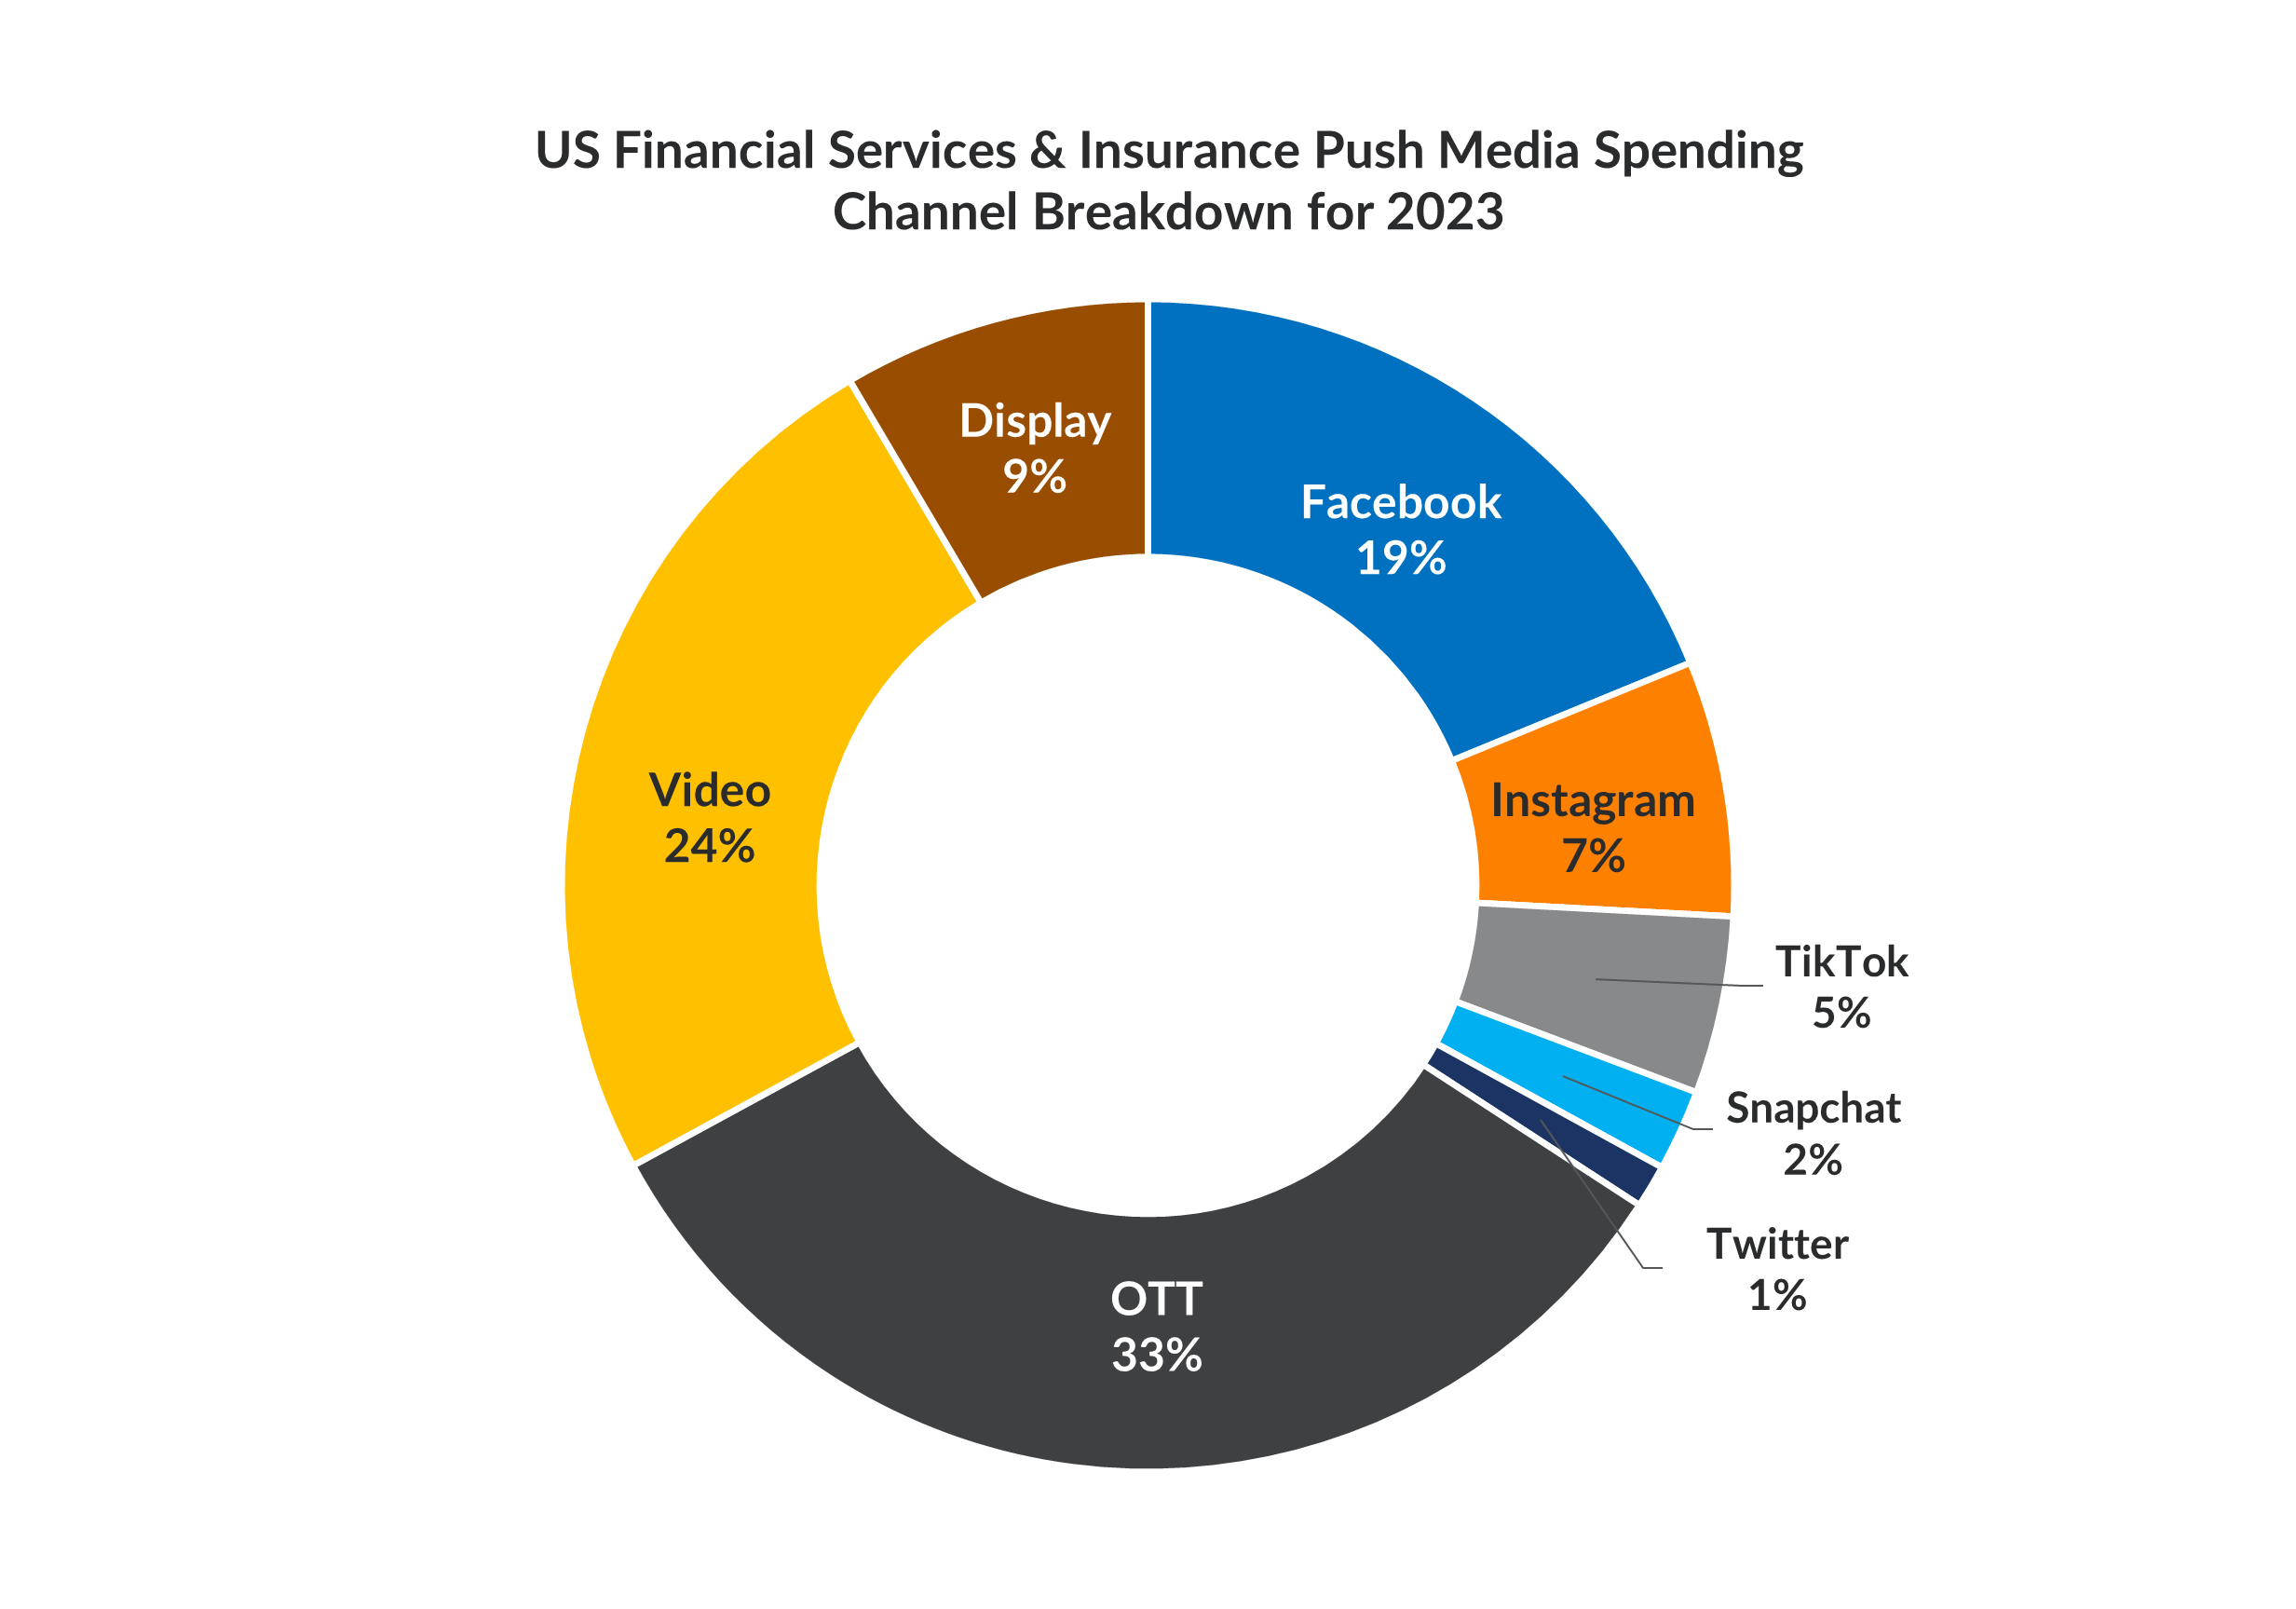
Social continues to be the leading channel for financial services with 34% share of the digital ad spending. OTT is a close second with a 33% share of all digital ad spending, a considerable growth from 2022.
TikTok and Snapchat’s share in the channel breakdown has gone up. Twitter, because of the current ongoing issues with the platform, has seen negligible spends in most of the categories.

The share of display has declined. Video & OTT continues to grow
The share of display has declined, and the decline is more significant in some sub-categories than others. For example, student loans saw a decline in share of display from 31% to 5%
Video continues to grow, however at a slower pace across sub-categories. Some segments, for example, mortgages and life insurance saw a steep climb in share of Video within their digital ad spending.
| Display | Video | OTT | ||||
|---|---|---|---|---|---|---|
| Category | Channel Share 2022 | Channel Share 2023 | Channel Share 2022 | Channel Share 2023 | Channel Share 2022 | Channel Share 2023 |
| Credit Card | 12% | 11% | 20% | 19% | 29% | 34% |
| Personal Loan | 9% | 3% | 5% | 6% | 12% | 40% |
| Student Loan | 31% | 5% | 9% | 12% | 9% | 29% |
| Mortgage | 24% | 18% | 11% | 23% | ||
| Life Insurance | 17% | 14% | 6% | 15% | 25% | 33% |
OTT’s growth can partly be
attributed to the significant growth in CTV
Time spent on CTV devices has nearly doubled in four years.
This increase in time and engagement is being driven by consumers watching more subscription over-the-top (sub OTT) services such as Amazon Prime and Netflix, more ad-supported video-on-demand (AVOD) services like Hulu and Tubi, and more YouTube.
In-depth digital media insights
Read our detailed analysis and insights specific to different Banking & Financial Services sub-categories here.